• R语言
  • 在使用ggplot时,如何将柱形和error bar放置于同一坐标系中?

问题描述

我的目的是使用 ggplot 绘制带 error bar 的柱状图。理想的柱状图是这样的:
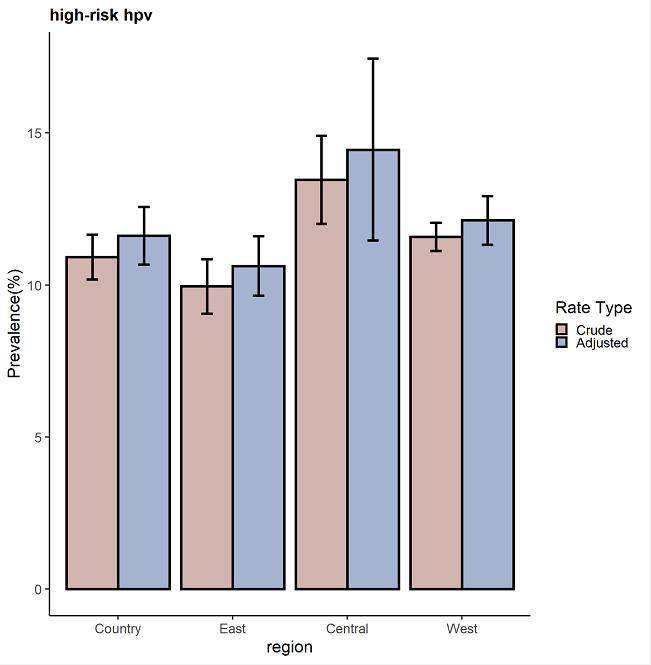
上面是我第一次运行这段代码产生的结果,后来只是更改了原始数据中的一些数字,再次绘图时却变成了这样:
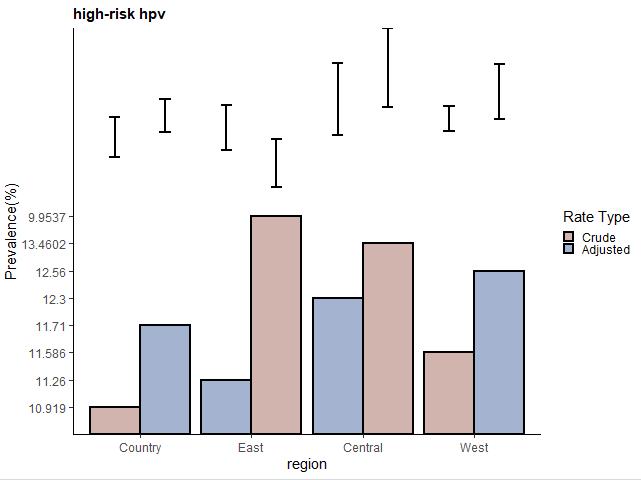
通过坐标轴看,似乎 error bar 另起了新的 y 坐标轴,但却又画在了一张图里。

我的代码和数据

这是我的绘图代码:

library(ggplot2)

data <- read.csv("region_hpv_rate.csv", stringsAsFactor=F)
data['region'] = factor(data$region, levels = c("Country", "East", "Central", "West"))
data['std'] = factor(data$std, levels = c("no", "Yes"))
data_high <- subset(data, type=="high")

ggplot(data_high, aes(x=region, y=rate, fill=std)) +
  geom_bar(position=position_dodge(), stat="identity", color='black', size=.8) +
  geom_errorbar(aes(ymin=lower, ymax=upper), width=.2, size=.8, position=position_dodge(.9)) +
  ggtitle("high-risk hpv") +
  theme_classic() +
  labs(x="region", y = "Prevalence(%)") +
  scale_fill_manual(values=c('#D2B4AE','#A4B3D0'), name = "Rate Type", labels = c("Crude", "Adjusted")) +
  theme(legend.key.size = unit(0.3, "cm"),
        plot.title = element_text(size = 11, face = "bold")
  )
ggsave("figures\\20190821\\figure1-1.png")

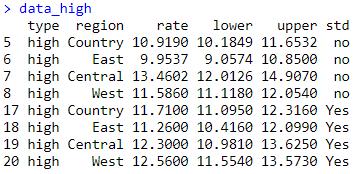
我的新数据如下:

> data_high
   type  region   rate   lower   upper std
5  high Country  10.919 10.1849 11.6532  no
6  high    East  9.9537  9.0574 10.8500  no
7  high Central 13.4602 12.0126 14.9070  no
8  high    West  11.586 11.1180 12.0540  no
17 high Country   11.71 11.0950 12.3160 Yes
18 high    East   11.26 10.4160 12.0990 Yes
19 high Central    12.3 10.9810 13.6250 Yes
20 high    West   12.56 11.5540 13.5730 Yes

考虑到这样排版可能会乱,再附一张截图:
    耶这问题挺好的嘛怎么又隐藏了,暂时恢复了

    顺便:看了一眼图2,y轴limit很奇怪,估计问题大概是rate类型变成字符串了

      yquiet

      library(ggplot2)
      type <- "high"
      region <- c("Country", "East", "Central", "West", 
                  "Country", "East", "Central", "West")  
      rate <- rnorm(8, 10, 1)
      lower <- rate - 0.5
      upper <- rate + 0.5 
      std <- c(rep("no", 4), rep("yes", 4))
      data_high <- data.frame(type, region, rate, lower, upper, std)
      ggplot(data_high, aes(x=region, y=rate, fill=std)) +
              geom_bar(position=position_dodge(), stat="identity", color='black', size=.8) +
              geom_errorbar(aes(ymin=lower, ymax=upper), width=.2, size=.8, position=position_dodge(.9)) +
              ggtitle("high-risk hpv") +
              theme_classic() +
              labs(x="region", y = "Prevalence(%)") +
              scale_fill_manual(values=c('#D2B4AE','#A4B3D0'), name = "Rate Type", labels = c("Crude", "Adjusted")) +
              theme(legend.key.size = unit(0.3, "cm"),
                    plot.title = element_text(size = 11, face = "bold")
              )

      你的作图代码没有问题,可能如 tc 所说,新数据集里的一些数据类型变了,你对比一下。

      tctcab 同样消失的帖子还有 <https://d.cosx.org/d/420859>。

      我揣度了一下,可能是问题已经解决了。作者如果自答一下“已解决”,就会被要求贴出解决方案,可是贴的话可能又太麻烦(调整格式啦,优化代码啦,注释啦),要付出更多时间成本,不如隐藏或删除了干净。

      也有可能是作者觉得提问不够妥当。

      我觉得这是一种负责任的态度。虽不如贴出解决方案来造福大众,但总胜过自己解决了却把问题晾在那里不吱声,胜过别人帮忙解决了不反馈。

      这种情况下要恢复吗?我有些犹豫。可能不如遵从作者意愿为好吧。