问题描述
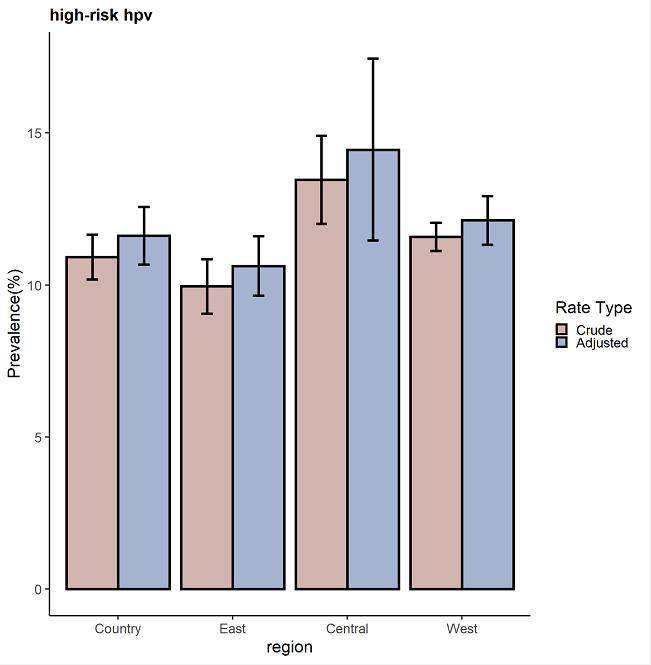
我的目的是使用 ggplot 绘制带 error bar 的柱状图。理想的柱状图是这样的:

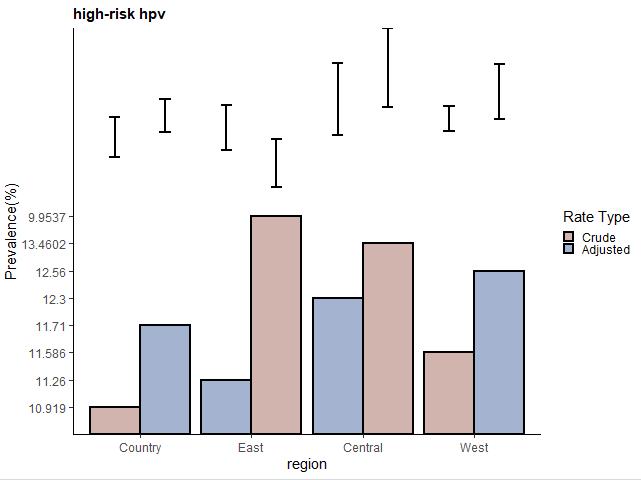
上面是我第一次运行这段代码产生的结果,后来只是更改了原始数据中的一些数字,再次绘图时却变成了这样:

通过坐标轴看,似乎 error bar 另起了新的 y 坐标轴,但却又画在了一张图里。
我的代码和数据
这是我的绘图代码:
library(ggplot2)

data <- read.csv("region_hpv_rate.csv", stringsAsFactor=F)
data['region'] = factor(data$region, levels = c("Country", "East", "Central", "West"))
data['std'] = factor(data$std, levels = c("no", "Yes"))
data_high <- subset(data, type=="high")

ggplot(data_high, aes(x=region, y=rate, fill=std)) +
  geom_bar(position=position_dodge(), stat="identity", color='black', size=.8) +
  geom_errorbar(aes(ymin=lower, ymax=upper), width=.2, size=.8, position=position_dodge(.9)) +
  ggtitle("high-risk hpv") +
  theme_classic() +
  labs(x="region", y = "Prevalence(%)") +
  scale_fill_manual(values=c('#D2B4AE','#A4B3D0'), name = "Rate Type", labels = c("Crude", "Adjusted")) +
  theme(legend.key.size = unit(0.3, "cm"),
        plot.title = element_text(size = 11, face = "bold")
  )
ggsave("figures\\20190821\\figure1-1.png")
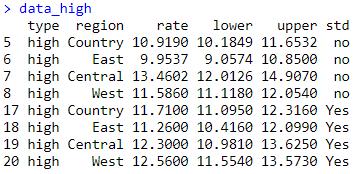
我的新数据如下:
> data_high
   type  region   rate   lower   upper std
5  high Country  10.919 10.1849 11.6532  no
6  high    East  9.9537  9.0574 10.8500  no
7  high Central 13.4602 12.0126 14.9070  no
8  high    West  11.586 11.1180 12.0540  no
17 high Country   11.71 11.0950 12.3160 Yes
18 high    East   11.26 10.4160 12.0990 Yes
19 high Central    12.3 10.9810 13.6250 Yes
20 high    West   12.56 11.5540 13.5730 Yes
考虑到这样排版可能会乱,再附一张截图:

