事情很简单,就是实验数据想分组做个 barplot,由于数据之间差别有点大所以需要给 Y 轴加 gap。

直接给例子吧:

set.seed(123)
vl <- c(rnorm(10) + 4, rnorm(8) + 50)
grp <- c(rep("A", 5),   # 实验有 4 个分组
         rep("B", 4),
         rep("C", 4),
         rep("D", 5))
lbs <- c(paste0("A", 1:5),   # 每组数据量不一
         paste0("B", 1:4),
         paste0("C", 1:4),
         paste0("D", 1:5))
colors <- c(rep("red", 5),  # 打算每组用不同的颜色
         rep("darkgreen", 4),
         rep("blue", 4),
         rep("orange", 5))
dat <- data.frame(id = 1:18,
                  group = grp,
                  label = lbs,
                  color = colors,
                  value = vl)
                  
# 先看看直接组图会长什么样子,后面再来自己一步一步修
barplot(value ~ id, dat)

得到平平无奇的柱图:
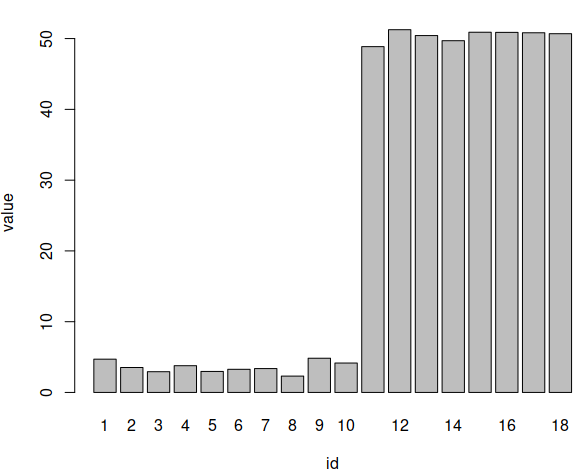
image.png

然后就是加上分组和颜色。

我没找到很完美的“自动”分组作图的方法,自己很笨地用了手动指定颜色和间隔:

atidx <- c(.5 + 1.2 * 0:4,
           .5 + 1.2 * 4 + 2 + 1.2 * 0:3,
           .5 + 1.2 * 4 + 2 + 1.2 * 3 + 2 + 1.2 * 0:3,
           .5 + 1.2 * 4 + 2 + 1.2 * 3 + 2 + 1.2 * 3 + 2 + 1.2 * 0:4)

sp <- c(0, rep(.2, 4), 1,
        rep(.2, 3), 1,
        rep(.2, 3), 1,
        rep(.2, 4))

barplot(value ~ label,
        col = colors,
        space = sp,
        border = "white",
        axes = FALSE, axisnames = FALSE,
        ylim = c(0, 56),
        data = dat)
axis(1, 
     lwd = 2,
     tck = -.01,
     # lwd.ticks = 2,
     at = atidx,
     # tick = FALSE,
     labels = FALSE, )
text(x = atidx,
     y = par("usr")[3] - 3,
     labels = dat$label,
     xpd = NA,
     ## Rotate the labels by 35 degrees.
     srt = 30,
     cex = .75)
axis(2, lwd = 2, at = c(seq(0, 60, 10)))

得到:
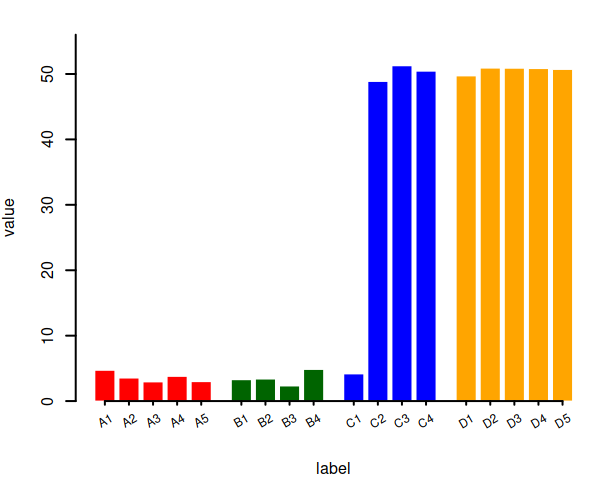
image.png

然后我就 Google 到了可以加 gap 的 plotrix 包:

library("plotrix")

gap.barplot(
  dat$value,
  xlab = "Sample",
  ylim = c(0, 25),
  xtics = 1:18,
  xaxlab = FALSE,
  ytics = c(5, 10, 15, 20, 45, 50, 55),
  gap = c(10, 40),
  col = dat$color
)
text(x = 1:18,
     y = par("usr")[3] - 1.5,
     labels = dat$label,
     xpd = NA,
     srt = 30,
     cex = .75)
plotrix::axis.break(
  axis = 2,
  breakpos = 10.4,
  breakcol = "black",
  style = "slash"
)
plotrix::axis.break(
  axis = 4,
  breakpos = 10.4,
  breakcol = "black",
  style = "slash"
)

是那个样子:
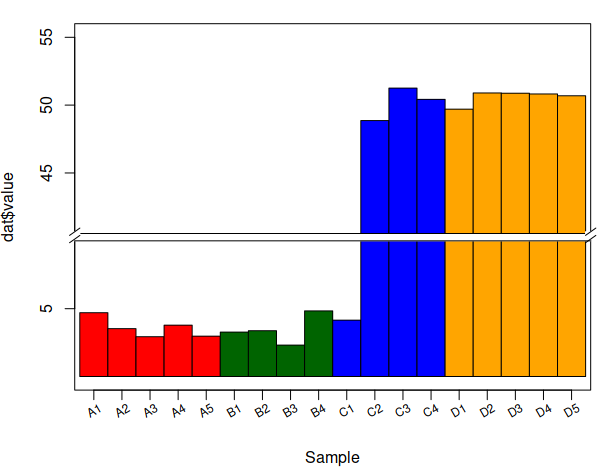
image.png

但是发现 gap.barplot() 不接受 borderspace 参数...这样分组就没法画图了。虽然 help 文档是说 ... 参数直接传给 barplot(),但是不知道为什么我加上 space 又不行。

然后我就求助了(可能)更强大的 ggplot2

library("ggplot2")
library("ggprism")

p <- ggplot(data = dat,
            aes(x = label, y = value,
                fill = group)) +
  geom_bar(position="dodge", stat="identity",
           width = .75, size = 1.5,
           # color = "black", 
           show.legend = FALSE) +
  geom_bar(stat = "identity", position = "dodge",
           # show.legend = FALSE,
           width = .75) +
  scale_fill_grey("Sample", start = .9, end = .1,
                  labels = c("A", "B", "C", "D")
  ) +
  ggprism::theme_prism(base_size = 14, base_family = "Arial") +  # 科研作图,选择了常用的 prism 主题
  scale_y_continuous(expand = expansion(mult = c(0, .1))) +
  theme(legend.position = c(.2, .8), legend.direction = "vertical") +
  theme(axis.text.x = element_text(angle = 45, vjust = .75, hjust = .65)) +
  NULL
p

还行:
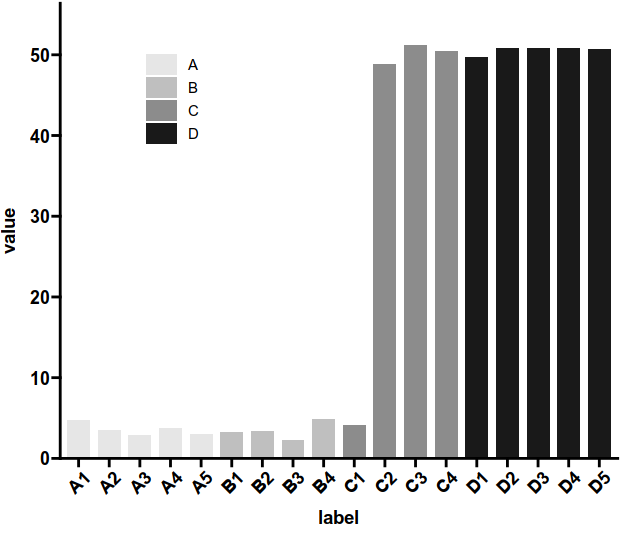
image.png

下面来加 gap 吧。 Google 到了 gg.gap:

library("gg.gap")
gg.gap(p, segments = list(c(10, 40)), ylim = c(0, 60))

额......
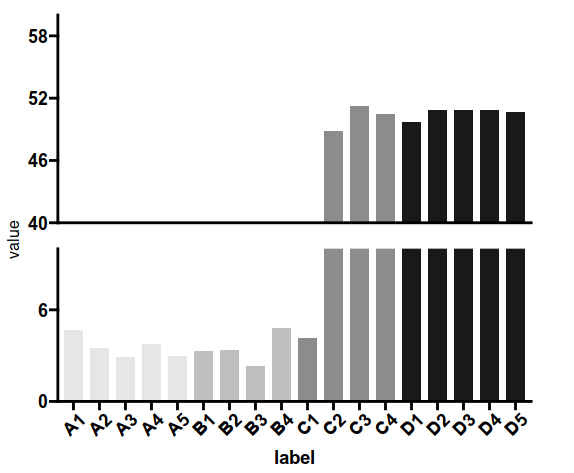
image.png

然后排除了一下

ggprism::theme_prism(base_size = 14, base_family = "Arial") 

scale_y_continuous(expand = expansion(mult = c(0, .1))) +

都和 gg.gap() 有点冲突,移除之后能得到类似想要的结果:
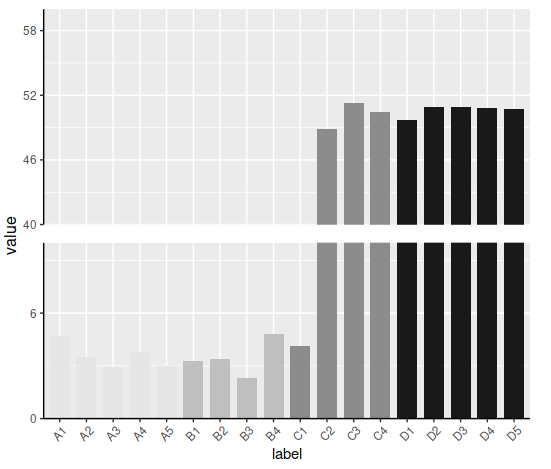
image.png

但是这个主题现在没法改了,gg.gap() 似乎和 theme_xxx_() 有冲突....

知道坛里作图高手多多,希望大家提点意见,我知道我的代码写得很烂,冗余度极高,大家尽管骂我😂

    JackieMe

    gg.gap() 似乎和 theme_xxx_() 有冲突....

    看了看gg.gap的代码,里面重写了theme()内容,所以你设置的legend就失效了,不过ggprism::theme_prism()不应该失效啊。

    改个theme_bw()你看看是不是你想要的样子

    library("ggplot2")
    library("ggprism")
    library("gg.gap")
    set.seed(123)
    vl <- c(rnorm(10) + 4, rnorm(8) + 50)
    grp <- c(rep("A", 5),   # 实验有 4 个分组
             rep("B", 4),
             rep("C", 4),
             rep("D", 5))
    lbs <- c(paste0("A", 1:5),   # 每组数据量不一
             paste0("B", 1:4),
             paste0("C", 1:4),
             paste0("D", 1:5))
    colors <- c(rep("red", 5),  # 打算每组用不同的颜色
             rep("darkgreen", 4),
             rep("blue", 4),
             rep("orange", 5))
    dat <- data.frame(id = 1:18,
                      group = grp,
                      label = lbs,
                      color = colors,
                      value = vl)
    
    p <- ggplot(data = dat,
                aes(x = label, y = value,
                    fill = group)) +
      geom_bar(position="dodge", stat="identity",
               width = .75, size = 1.5,
               # color = "black", 
               show.legend = FALSE) +
      geom_bar(stat = "identity", position = "dodge",
               # show.legend = FALSE,
               width = .75) +
      scale_fill_grey("Sample", start = .9, end = .1,
                      labels = c("A", "B", "C", "D")
      ) +
      theme_bw()+
      # ggprism::theme_prism(base_size = 14, base_family = "Arial") +  # 科研作图,选择了常用的 prism 主题
      # scale_y_continuous(expand = expansion(mult = c(0, .1))) +
      # theme(legend.position = "bottom", legend.direction = "vertical") +
      theme(axis.text.x = element_text(angle = 45, vjust = .75, hjust = .65)) 
    
    gg.gap(p, segments = list(c(10, 40)), ylim = c(0, 60))

    <sup>Created on 2020-12-17 by the reprex package (v0.3.0)</sup>

      tctcab 啊,great,谢谢!不会看源码真是无力啊。

      加上一句

      theme(panel.grid.major = element_blank(), panel.grid.minor = element_blank()) 

      基本上就是我想要的样子了,但是发现好像柱子分组没了,理想的样子应该是 A/B/C/D 几组柱子间隔大,组内柱子没有间隔或者间隔很小,类似于 barplot() 实现的效果....

      JackieMe
      你不觉得这种断开的轴很丑吗?突出小值差异的话用指数轴也行啊:

      set.seed(123)
      vl <- c(rnorm(10) + 4, rnorm(8) + 50)
      grp <- c(rep("A", 5),   # 实验有 4 个分组
               rep("B", 4),
               rep("C", 4),
               rep("D", 5))
      lbs <- c(paste0("A", 1:5),   # 每组数据量不一
               paste0("B", 1:4),
               paste0("C", 1:4),
               paste0("D", 1:5))
      colors <- c(rep("red", 5),  # 打算每组用不同的颜色
                  rep("darkgreen", 4),
                  rep("blue", 4),
                  rep("orange", 5))
      dat <- data.frame(id = 1:18,
                        group = grp,
                        label = lbs,
                        color = colors,
                        value = vl)
      barplot(value ~ id, data = dat, log = "y", ylim = c(1, 60))

      <sup>Created on 2020-12-17 by the reprex package (v0.3.0)</sup>

        Liechi 话是这样说没错啦,我也想过用 log Y 轴作图。但是我自己实际在文献(临床医学方向)里很少看到这样作图的,而且给别人展示的时候你也得特意强调这个是 Y 轴(不均匀轴),不然别人大概一看很容易解读不到正确的意思。

          JackieMe

          library("ggplot2")
          library("ggprism")
          library("gg.gap")
          set.seed(123)
          vl <- c(rnorm(10) + 4, rnorm(8) + 50)
          grp <- c(rep("A", 5),   # 实验有 4 个分组
                   rep("B", 4),
                   rep("C", 4),
                   rep("D", 5))
          lbs <- c(paste0( 1:5),   # 每组数据量不一
                   paste0( 1:4),
                   paste0( 1:4),
                   paste0( 1:5))
          colors <- c(rep("red", 5),  # 打算每组用不同的颜色
                   rep("darkgreen", 4),
                   rep("blue", 4),
                   rep("orange", 5))
          dat <- data.frame(id = 1:18,
                            group = grp,
                            label = lbs,
                            color = colors,
                            value = vl)
          
          p <- ggplot(data = dat,
                      aes(x = group, y = value,
                          fill = label,group=label)) +
            geom_col(position=position_dodge(0.5),
                     width=0.5
                     ) +
            theme_bw()+
            theme(axis.text.x = element_text(angle = 45, vjust = .75, hjust = .65))+
            scale_y_log10()
          p

          <sup>Created on 2020-12-18 by the reprex package (v0.3.0)</sup>

          这个怎么样。group分开了,用不同颜色区分label,y轴用log10

          你的原图可能存在的几个问题是

          • 用颜色和位置两个作图元素来区分group,属于冗余
          • y轴加gap之后,不连续的Y轴会让【柱高度表示变量大小】这一点变得不直观有误导性。
          • 不要以为发表的临床paper里的图表就代表了best practice,这是教条主义。实际作图时候的指导思想还是实事求是,简洁清晰地传达意思最为重要。这里安利一下我导师的科技论文写作指导里图表部分 :

          。写文章的目的不是去测试读者的阅读能力,而是考验作者的表达能力。不能怪人没看懂,只能怪自己没写清楚。
          一些没有耐心的读者会直接通过图表来判断一篇文章是否值得一读。怎样能使读者不需读正文就能理解图表是至关重要的。

          由于用的不是实际数据,如何让图传达你的意思实际上还可以再讨论。

            tctcab

            tctcab 这个怎么样。group分开了,用不同颜色区分label,y轴用log10

            👍,也是一种办法

            tctcab 用颜色和位置两个作图元素来区分group,属于冗余

            嗯,对的,这个是冗余的。

            tctcab y轴加gap之后,不连续的Y轴会让【柱高度表示变量大小】这一点变得不直观有误导性。
            不要以为发表的临床paper里的图表就代表了best practice,这是教条主义。实际作图时候的指导思想还是实事求是,简洁清晰地传达意思最为重要。这里安利一下我导师的科技论文写作指导里图表部分 :

            大道理都懂,但是顶不住你汇报或者给老板看文章的时候 “这个图你按别人发表的文章里的样式重新画一个” 一句话啊

              JackieMe
              这不是什么大道理......图表是为传达信息服务的,从准确度,简练程度和审美等方面可大致判断一个图表的优劣,这是一个合格的科研人员应该具有的基本素养。坦白说,如果你老板连图表格式都要跟风而不是根据自己的数据做出合适的判断,我难以想象跟这样的研究人员能学到什么真东西。

              也不要担心读者会被非均匀的 y 轴带偏,如果你的工作够好,那大多数读者都不会太笨。另外,看图连坐标轴是啥都不看清楚的人,也没有必要太迁就。你会因为担心有人不识字,于是坚持用拼音写论文吗?

              我不否认有时这种间断的 y 轴有用武之地,但在你这个例子里看不出来其优势,而且你给的用这种形式的理由也非常不好。

                Liechi

                这个问题更大了,我觉得国内科研人员亟需提高素质。封建师徒制的研究生制度也得改。

                前天我师弟还被国内导师一个跨洋电话打过来,要求帮他儿子替考国外大学线上的一门考试,我寻思这0202年了还能这样?

                  tctcab
                  文革时期教育断了差不多十年,大量优秀研究人员无法继续教育和科研工作,导致科教传承出现断层,在八九十年代,稍微多受点本科教育的都算是"高级知识分子"。九十年代末期到两千年头十年,为了缓解由于上一波生育高峰造成过剩的青壮劳动力进入劳动市场,造成就业压力,大学大量扩招学生,由此也大量扩招了大学老师。由于出现教育断层,人才素质普遍偏低,由于教师扩招,大量不达标的人进入大学任教,这两件事一结合导致现在大学的很多教育职位被不合格的人占据,于是现在各种乱象频出。这批滥竽充数的人数量不容小觑,他们现在也正好熬出了资历,正是破坏性最大的时候。现在科研领域的好些乱象都由此而出。

                  这些年见过的一些事情让我非常反感,但不在这里开启吐槽模式了。好在开放后,和西方接轨,在科研上接受了输血 (也为国外输送了大量人才),现在中国各方面都起步了。等这批人退休了,年轻的本土学者成长起来,本土的科研血脉再次完全接起来了,各种乱象应该就会轻很多了。

                  刚好前几天学生问我这个问题。

                  如果是对数坐标,最好画出线性分隔的网格线,以便读者理解。

                  这里暂且抛开这图该不该画的问题,只谈怎么画。其实我觉得 @JackieMe 找到 plotrix 的时候只差临门一脚了,可惜走偏到了 ggplot2 的岔路上。

                  下面是我的 R 基础作图方案(右图):

                  gap.png

                  思路就是修改数据,在坐标轴上动手脚。具体来讲,指定间断的位置在 y = 12 的位置,所有超过 12 的value 值都减去 30,这样做 barplot,然后把坐标轴上超过 12 的标签都减去 30 就行了。最后画一条白色横线。完整代码如下:

                  # 准备数据,来自楼主代码:
                  set.seed(123)
                  vl <- c(rnorm(10) + 4, rnorm(8) + 50)
                  grp <- c(rep("A", 5),   # 实验有 4 个分组
                           rep("B", 4),
                           rep("C", 4),
                           rep("D", 5))
                  lbs <- c(paste0("A", 1:5),   # 每组数据量不一
                           paste0("B", 1:4),
                           paste0("C", 1:4),
                           paste0("D", 1:5))
                  colors <- c(rep("red", 5),  # 打算每组用不同的颜色
                              rep("darkgreen", 4),
                              rep("blue", 4),
                              rep("orange", 5))
                  dat <- data.frame(id = 1:18,
                                    group = grp,
                                    label = lbs,
                                    color = colors,
                                    value = vl)
                  
                  # 修改数据
                  ygap <- 12
                  yshift <- 30
                  dat$value_new <- ifelse(dat$value > ygap, dat$value - yshift, dat$value)
                  
                  # 对新数据作条形图
                  barplot(value_new ~ label,
                          col = colors,
                          space = sp,
                          border = "white",
                          axes = FALSE, axisnames = FALSE,
                          ylim = c(0, 56 - yshift),
                          data = dat)
                  
                  # 加一条白色横线
                  abline(h = ygap, col = "white", lwd = 6)
                  
                  # x 轴,来自楼主代码
                  axis(1, 
                       lwd = 2,
                       tck = -.01,
                       # lwd.ticks = 2,
                       at = atidx,
                       # tick = FALSE,
                       labels = FALSE, )
                  text(x = atidx,
                       y = par("usr")[3] - 3,
                       labels = dat$label,
                       xpd = NA,
                       ## Rotate the labels by 35 degrees.
                       srt = 30,
                       cex = .75)
                  
                  # y 轴
                  yat <- pretty(dat$value_new)
                  ylab <- ifelse(yat > ygap, yat + yshift, yat)
                  axis(2, at=yat, labels=ylab)
                  plotrix::axis.break(2, ygap, style="slash")
                  box()

                    dapengde 还是思维局限,没想到画出来再加白线挡住这种神思路,赞 + 100!

                    又发现我这个 atidx 人肉算位置简直弱爆了,atidx <- barplot(...) 返回的就是位置信息了

                    dapeng 用 base plot 比较简单。我想了个用 ggplot 的 facet 拼接上下两个图,勉强可以实现,觉得比较麻烦,权当熟悉 ggplot 了。

                    set.seed(123)
                    vl <- c(rnorm(10) + 4, rnorm(8) + 50)
                    grp <- c(rep("A", 5),   # 实验有 4 个分组
                             rep("B", 4),
                             rep("C", 4),
                             rep("D", 5))
                    lbs <- c(paste0("A", 1:5),   # 每组数据量不一
                             paste0("B", 1:4),
                             paste0("C", 1:4),
                             paste0("D", 1:5))
                    colors <- c(rep("red", 5),  # 打算每组用不同的颜色
                                rep("darkgreen", 4),
                             rep("blue", 4),
                             rep("orange", 5))
                    dat <- data.frame(id = 1:18,
                                      group = grp,
                                      label = lbs,
                                      color = colors,
                                      value = vl)
                                      
                    
                    # 1. 根据 facet 作图
                    
                    ## 先根据 gap 处的阈值设置facet, 参考dapeng的设置间断位置在12
                    dat$facet <- factor(ifelse(dat$value > 12, "up", "down"), levels = c("up", "down"))
                    
                    library(ggplot2)
                    ggplot(dat, aes(label, value)) +
                      geom_col(aes(fill = color), width = 0.8) +
                      scale_fill_identity() +
                      facet_grid(rows = vars(facet), scales = "free_y") +
                      theme(strip.background = element_blank(), strip.text = element_blank(),
                            legend.position = "none") # 去除legend和facet

                    
                    # 2. 设置上下两个 facet 的limit
                    # ggplot2 目前不支持单独设置 每个 facet 的scale,在这里
                    # https://github.com/tidyverse/ggplot2/issues/1613#issuecomment-404143658
                    # 看到有个facetscales包可以用来分别设置不同facet的limit
                    
                    if (!require("facetscales")) remotes::install_github("zeehio/facetscales")
                    #> Loading required package: facetscales
                    scales_y <- list(
                      "down" = scale_y_continuous(limits = c(0, 12), breaks = seq(0, 12, 3), expand = c(0,0)),
                      "up" = scale_y_continuous(limits = c(40, 55), breaks = seq(40, 55, 5))
                    )
                    
                    ggplot(dat, aes(label, value)) +
                      geom_col(aes(fill = color), width = 0.8) +
                      scale_fill_identity() +
                      facet_grid_sc(rows = vars(facet), scales = list(y = scales_y)) +
                      theme(strip.background = element_blank(), strip.text = element_blank(),
                            legend.position = "none")

                    # 3. gap 12 和 40离的太近
                    # 减小上面 facet y的最小值 40 -> 35, 
                    # 增加下面 facet 最大值 12 -> 15, 同时需要设置dat2$value为15
                    scales_y <- list(
                      "down" = scale_y_continuous(
                        limits = c(0, 15), 
                        breaks = seq(0, 12, 3), 
                        expand = c(0,0)),
                      "up" = scale_y_continuous(limits = c(35, 55), breaks = seq(40, 55, 5))
                    )
                    ggplot(dat, aes(label, value)) +
                      geom_col(aes(fill = color), width = 0.8) +
                      scale_fill_identity() +
                      facet_grid_sc(rows = vars(facet), scales = list(y = scales_y)) +
                      theme(strip.background = element_blank(), strip.text = element_blank(),
                            legend.position = "none")

                    # 4. 在下面的facet中添加数据,C2:D5 的 value 为 15 (limit的最大值), facet 为 "down"
                    dat2 <- dat[dat$facet == "up", ]
                    dat2$value <- 15
                    dat2$facet <- "down"
                    dat <- rbind(dat, dat2)
                    
                    ggplot(dat, aes(label, value)) +
                      geom_col(aes(fill = color), width = 0.8) +
                      scale_fill_identity() +
                      facet_grid_sc(rows = vars(facet), scales = list(y = scales_y)) +
                      theme(strip.background = element_blank(), strip.text = element_blank(),
                            legend.position = "none")

                    # 5. 分组之间的 space,设置 facet_grid 中的 cols
                    ggplot(dat, aes(label, value)) +
                      geom_col(aes(fill = color), width = 0.8) +
                      scale_fill_identity() +
                      facet_grid_sc(
                        rows = vars(facet), 
                        cols = vars(group), 
                        scales = list(y = scales_y, x = "free")) +
                      theme_classic() +
                      theme(strip.background = element_blank(), 
                            strip.text = element_blank(),
                            legend.position = "none")

                    <sup>Created on 2020-12-19 by the reprex package (v0.3.0)</sup>

                    4 天 后

                    截断 y 轴或者对数坐标系下不应使用 barchart,因为这时 bar 的长短已经无法准确编码数值大小,没什么意义。关于这个原理的论述可参考 Cleveland (1984) Graphical Methods for Data Presentation: Full Scale Breaks, Dot Charts, and Multibased Logging.

                    按照上文的推荐,这里可用 dot chart,结合 full scale break 或者对数坐标系。

                    library("ggsci")
                    
                    set.seed(123)
                    
                    df <- data.frame(
                      group = c(rep("A", 5), rep("B", 4), rep("C", 4), rep("D", 5)),
                      label = c(paste0("A", 1:5), paste0("B", 1:4), paste0("C", 1:4), paste0("D", 1:5)),
                      value = c(rnorm(10) + 4, rnorm(8) + 50)
                    )
                    
                    col <- pal_aaas()(length(unique(df$group)))[as.integer(as.factor(df$group))]
                    
                    op <- par(no.readonly = TRUE)
                    layout(matrix(c(1, 2), nrow = 1, ncol = 2), widths = c(1, 1))
                    par(mar = c(5, 0.5, 4, 0.5) + 0.1)
                    dotchart(x = df$value, labels = df$label, col = col, xlim = c(0, 10))
                    dotchart(x = df$value, col = col, xlim = c(46, 56))
                    par(op)

                    得到大家各种意见和解决方法很感激。

                    这个数据是模拟数据,我的实际处理数据其实是一个 qPCR 的实验结果,一共 4 个动物模型(A/B/C/D),每个模型内又有不同的处理时间(如 A1 ~ A4),对于某个基因来说,为了直观显示在不同模型和同一模型不同处理时间情况下这个基因的变化情况,用 ΔΔCt 法得到所有的 normalized ratio 和 std error,然后想用这个这个倍数变化值来做条图。

                    实际上在文献里看到展示 qPCR 的结果一般也都是条图 + error bar 来展示的,所以我一直强调我就是要条图。

                    5 个月 后