• R语言
  • 【已解决】ggplot2 fill指令的颜色深浅怎么根据数据的大小设置?

这里有一个示例:

ggplot(faithfuld, aes(waiting, eruptions)) +
 geom_raster(aes(fill = density))

raster

问题:

  1. 如果我想让高数值颜色更深,在不使用fill = -density的情况下(即保证图例不变)应该如何完成?
  2. 如何更换fill的颜色?

    Hoas 我推荐你用 viridis 调色板,你再试试

    library(ggplot2)
    options(
      ggplot2.continuous.colour = "viridis",
      ggplot2.continuous.fill = "viridis"
    )
    ggplot(faithfuld, aes(waiting, eruptions)) +
     geom_raster(aes(fill = density))

      Hoas 图里的颜色深浅跟图例是一一对应的,最好不要自行修改。

      如果你想要展示差异,Cloud2016 的办法很好。公式网站上给出的例子用的调色板(scale_fill_distiller(palette = "Spectral"))也不错,可以参考一下。


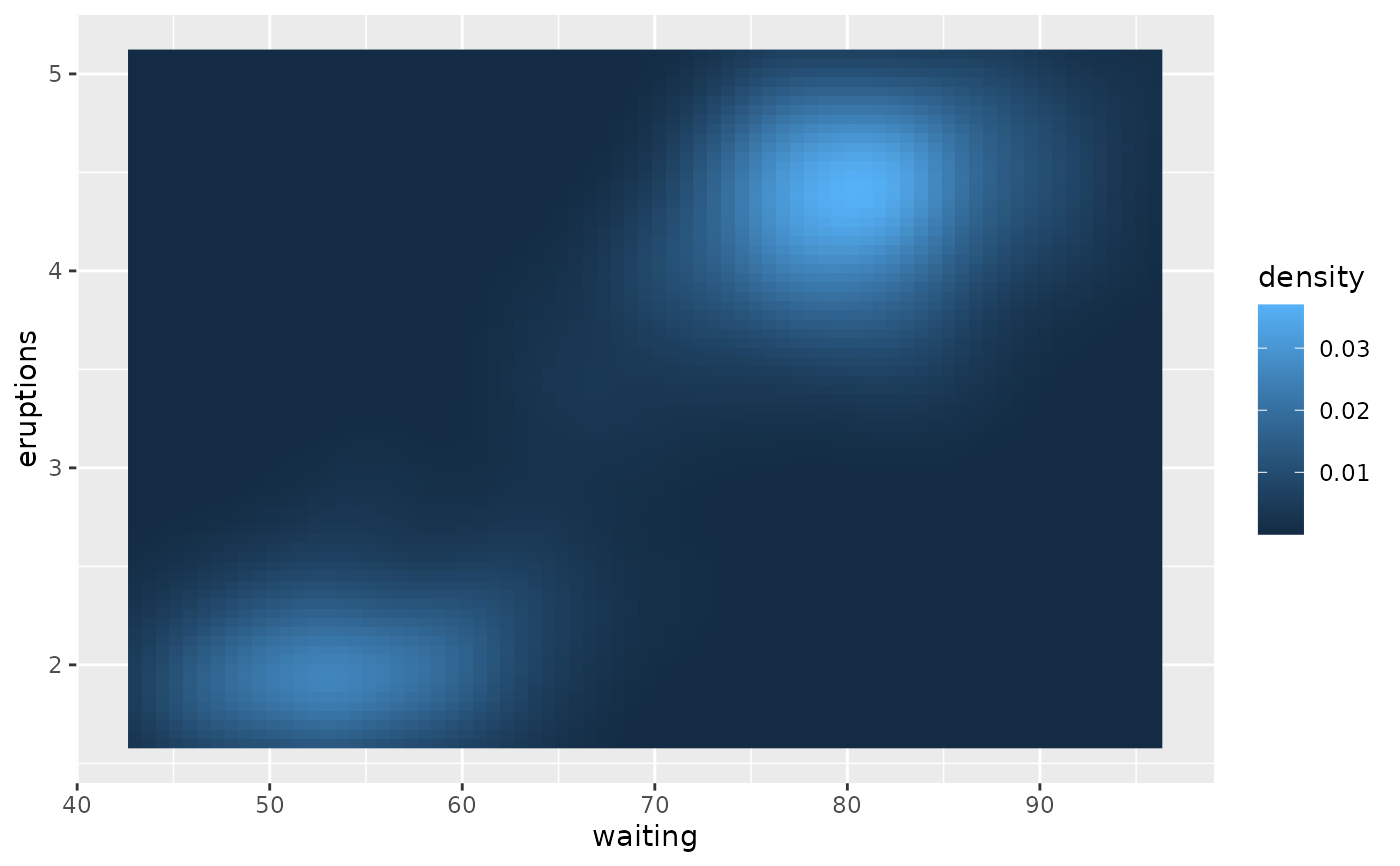
      看来我阅读理解该扣分了,先前没有明白你的意思。你看这样可以吗?

      ggplot(faithfuld, aes(waiting, eruptions)) + 
          scale_fill_gradient(low = "white", high = "blue") +
          geom_raster(aes(fill = density)) 
      • Hoas 回复了此帖
      • Fye 觉得很赞
        Hoas 更改标题为「【已解决】ggplot2 fill指令的颜色深浅怎么根据数据的大小设置?