新增ggplot2实现:
library(easyGgplot2)
library(cowplot)
library(ggplot2)
data(PlantCounts,package = 'MSG')
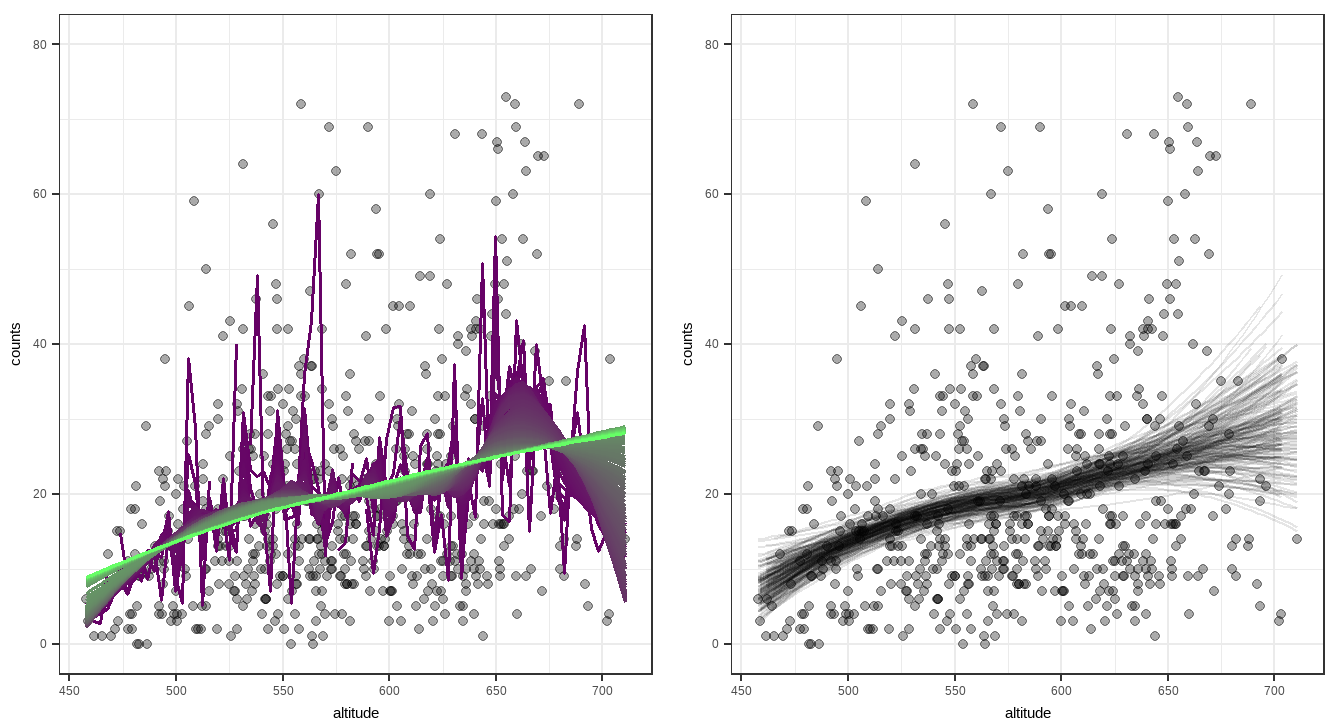
g = ggplot(PlantCounts,
aes(altitude,counts)) +
geom_point(size=1.5,alpha=1/3) +
ylim(0,80)+
theme_bw()
for (i in seq(1,1000,10)){
col = rgb(0.4,i/1000,0.4)
g = g + stat_smooth(geom='line',
span=i/1000,
size=0.5,
se=F,color=col)
}
f = ggplot(PlantCounts,
aes(altitude, counts)) +
geom_point(size=1.5,alpha=1/3) +
ylim(0,80)+
theme_bw()
for (i in 1:200){
idx = sample(nrow(PlantCounts),300,T)
df = PlantCounts[idx,]
f = f + stat_smooth(geom='line',
data=df,
aes(altitude,counts),
span=1,size=0.5,
se=F,alpha=1/10)
}
# ggplot2.multiplot(g,f,cols=2)
plot_grid(g, f, ncol = 2)