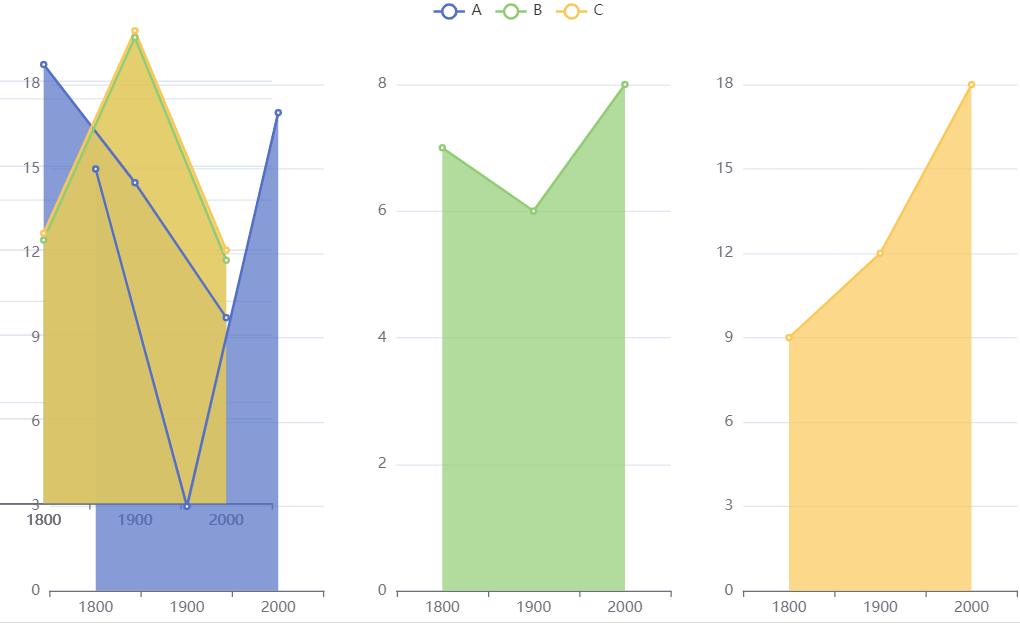
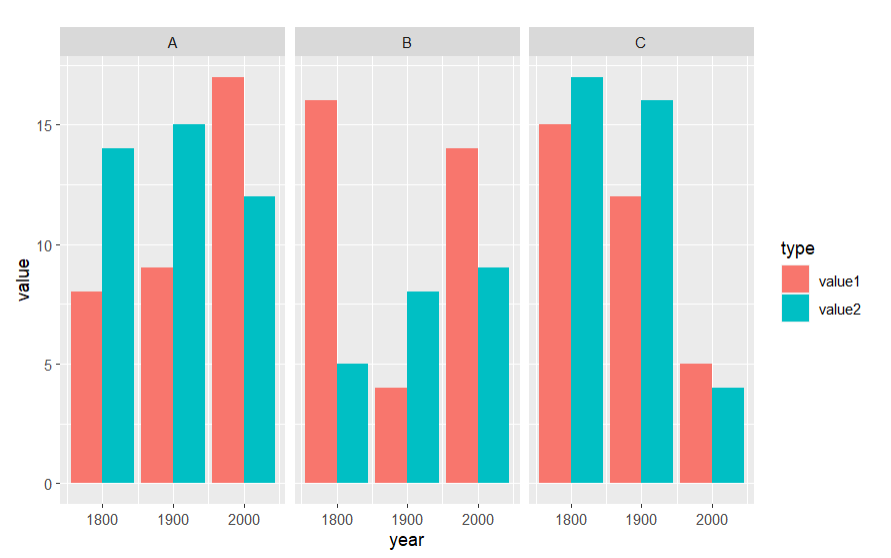
楼主想在分面的情况下让每个图绘制两个指标,执行下面这段代码,可以得到下面那个有问题的图,看到图就会知道古怪在哪……路过的坛友有兴趣可以瞅瞅。
library(echarts4r)

data <- data.frame(
  label = c(rep('A', 3), rep('B', 3), rep('C', 3)),
  year=rep(c(1800,1900,2000),3),
  value1 = sample(1:20, 9),
  value2 = sample(10:30, 9)
)

data |>
  group_by(label) |>
  e_charts(year) |>
  e_area(value1) |>
  e_area(value2) |>
  e_x_axis(type = 'category') |>
  e_facet(
    rows = 1, # 分面的行数
    cols = 3, # 分面的列数
    legend_pos = "top",
    legend_space = 12
  )

换 ggplot2 试试,是可行的。
library(ggplot2)

data <- data.frame(
  label = c(rep('A', 6), rep('B', 6), rep('C', 6)),
  year = rep(c(1800, 1800, 1900, 1900, 2000, 2000), 3),
  type = rep(c('value1', 'value2'), 9),
  value = sample(1:20, 9)
)

ggplot(data = data) + geom_bar(
  mapping = aes(x = year, y = value, fill = type),
  position = 'dodge',
  stat = 'identity'
) + facet_wrap(vars(label), ncol = 3)
