mansuper
你的代码有很多问题,总结的话:
- 构造示例数据方法有点问题,所有数字被转成了factor
- ggplot函数的aes(x=xvalue,y=yvalue)依赖于环境里的xvalue,yvalue, 会随你当前工作环境里的xvalue和yvalue改变。正确的姿势是用aes_string()来传递字符串
- grid.arrange里不用把plot_list都敲一遍
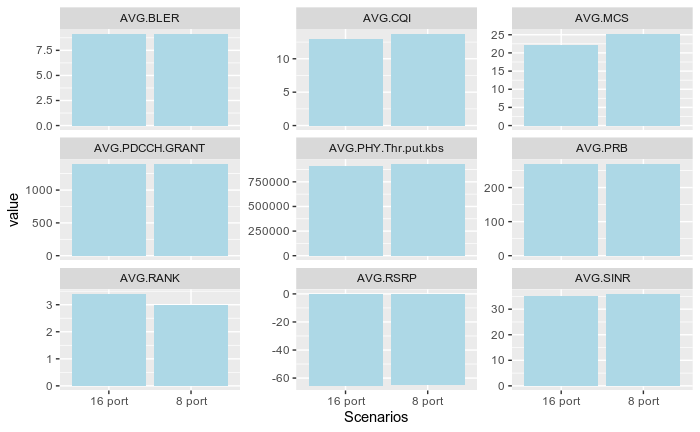
帮你清理了一下:
library("magrittr")
library('ggplot2')
library("gridExtra")
library(data.table)
#Prepare the data


testdata=data.table::fread("Scenarios,AVG.SINR,AVG.RSRP,AVG.PHY.Thr.put.kbs,AVG.RANK,AVG.PRB,AVG.CQI,AVG.MCS,AVG.PDCCH.GRANT,AVG.BLER
8 port,35.98,-65.20,933506.1,3.0,269.82,13.77,25.32,1400.7,9.13
16 port,35.04,-65.56,910668.8,3.4,269.17,12.97,22.17,1400.7,9.17")

CreateBarPlot<-function(thedf,xname,yname) {

  barplot<-ggplot(thedf, aes_string(x=xname, y=yname))+
                geom_bar(stat="identity",fill="lightblue")+
                geom_text(aes_string(label=yname), vjust=1.5,size=12)
   return(barplot)
}


plot_list <- list()
listcolname<-names(testdata)

for (i in 2:length(listcolname)){
      thedf<-testdata
      xvalue=listcolname[1]
      yvalue=listcolname[i]

      plot_list=append(plot_list,list(CreateBarPlot(thedf, xvalue,yvalue)))
}

grid.arrange(grobs=plot_list,nrow=4)

<sup>Created on 2020-03-04 by the reprex package (v0.3.0)</sup>
但感觉数字太大有点丑阿,而且还对不齐…