#百思不得其姐,循环读数画图,为什么最后的Y-值都是一样的? 单独画是正常的。大家有空复制以下代码跑下,看看问题在哪里,谢谢。
library("magrittr")
library('ggplot2')
library("gridExtra")
#Prepare the data
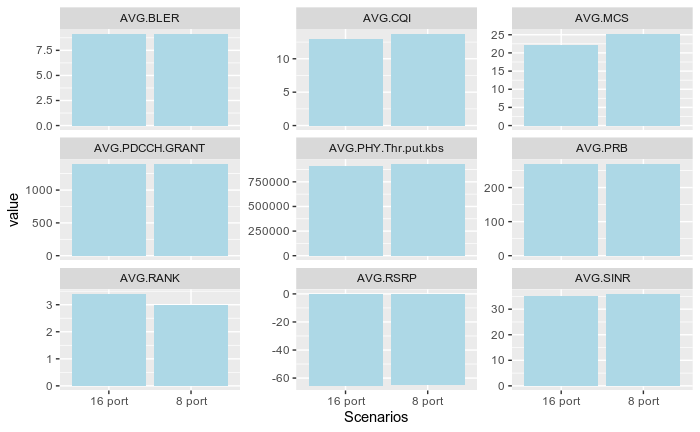
TheColname<-c("Scenarios","AVG.SINR","AVG.RSRP","AVG.PHY.Thr.put.kbs","AVG.RANK", "AVG.PRB","AVG.CQI","AVG.MCS","AVG.PDCCH.GRANT","AVG.BLER")
Case1data<-c("8 port",35.98,-65.20,933506.1,3.0,269.82,13.77,25.32,1400.7,9.13)
Case2data<-c("16 port",35.04,-65.56,910668.8,3.4,269.17,12.97,22.17,1400.7,9.17)
names(Case1data)<-TheColname
names(Case2data)<-TheColname
testdata<-rbind(Case1data,Case2data)%>%as.data.frame()
#Function create bar plot

CreateBarPlot<-function(thedf,xvalue,yvalue,ylabname) {

  barplot<-ggplot(thedf, aes(x=xvalue, y=yvalue))+
                geom_bar(stat="identity",fill="lightblue")+
                geom_text(aes(label=yvalue), vjust=1.5,size=12)+
                ylab(ylabname) +
                xlab("")
   return(barplot)
}
##Create plot by Loops,use for ,call the function CreateBarPlot

plot_list <- list()
listcolname<-names(testdata)

for (i in 2:length(listcolname)){
      thedf<-testdata
      xvalue<-thedf[,1]
      yvalue<-thedf[,i]
      ylabname<-listcolname[i]
     plot_list[[i]]<-CreateBarPlot(thedf,xvalue,yvalue,ylabname)
}
#View the plot list
grid.arrange(plot_list[[2]], plot_list[[3]], plot_list[[4]], plot_list[[5]], plot_list[[6]],
                        plot_list[[7]], plot_list[[8]], plot_list[[9]], plot_list[[10]],nrow=4)