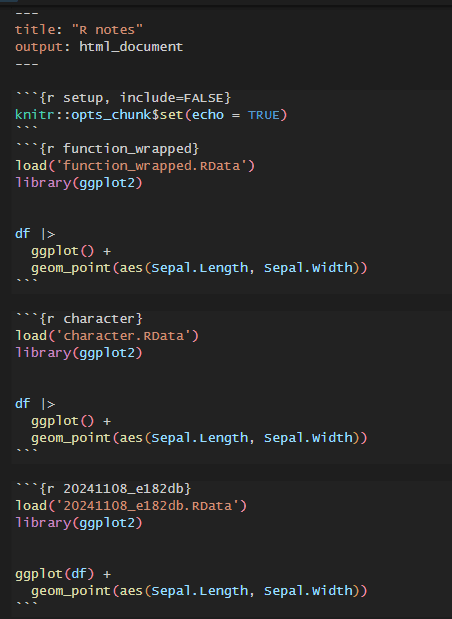
可复现的"较小"案例包括代码, 代码的运行结果, 依赖与变量, 这些我尝试通过一个包来整合和写出. 这只是我一个月前一个偶然的想法, 今天完善了一下, 意义上来看可能没这么大, 权当练手了.
从实际情况来考虑"较小"的案例涉及到数据/代码脱敏, 分享途径受限的问题. 以及数据本身往往不需要导出, 可以通过内置数据集或者构建数据集来模拟.
以下是两个示例:
df = iris |>
  select(Sepal.Length, Sepal.Width)

noter(
  \() {
    df |>
      ggplot() +
      geom_point(aes(Sepal.Length, Sepal.Width))
  },
  taskID = 'function_wrapped'
)

noter(
  'df |>
    ggplot() +
    geom_point(aes(Sepal.Length, Sepal.Width))',
  taskID = 'character'
)

noter(
  df |>
    ggplot() +
    geom_point(aes(Sepal.Length, Sepal.Width)),
  expr = T
) # equals to noter_expr

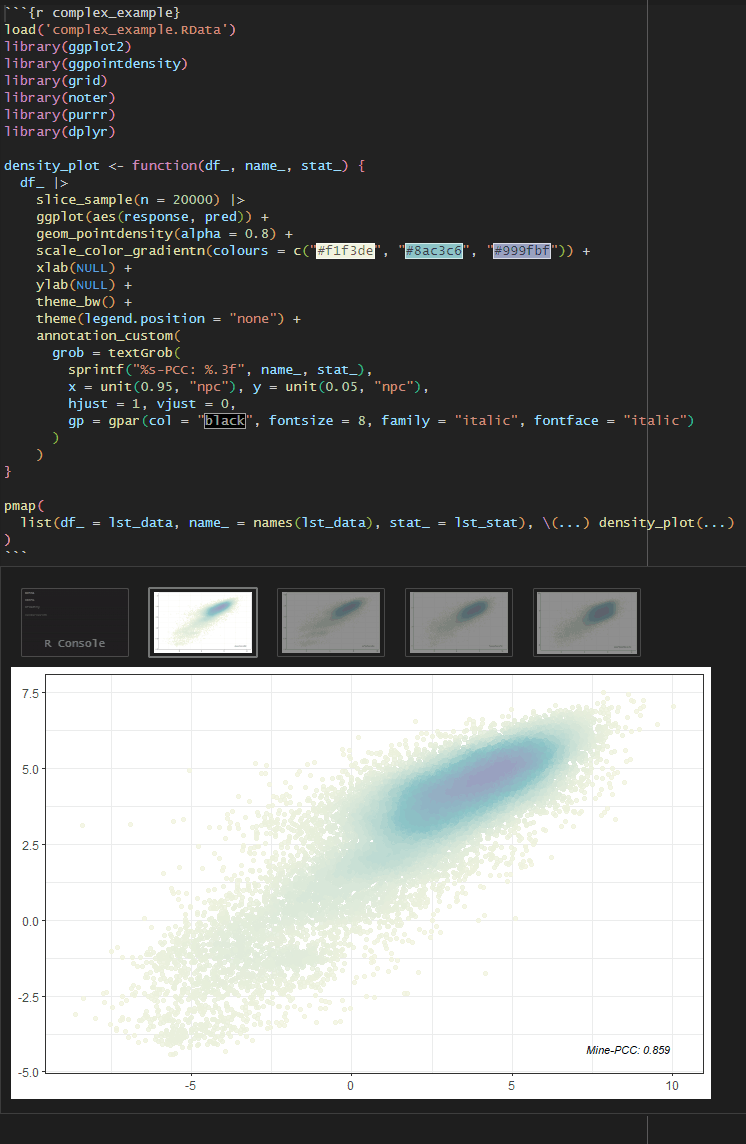
一个较复杂的案例:
density_plot = function(df_, name_, stat_) {

  df_ |>
    slice_sample(n = 20000) |>
    ggplot(aes(response, pred)) +
    geom_pointdensity(alpha = 0.8) +
    scale_color_gradientn(colours = c('#f1f3de', '#8ac3c6', '#999fbf')) +
    xlab(NULL) +
    ylab(NULL) +
    theme_bw() +
    theme(legend.position = 'none') +
    annotation_custom(
      grob = textGrob(
        sprintf('%s-PCC: %.3f', name_, stat_),
        x = unit(0.95, "npc"), y = unit(0.05, "npc"),
        hjust = 1, vjust = 0,
        gp = gpar(col = "black", fontsize = 8, family = "italic", fontface = "italic")
      )
    )

}

noter(
  \() {
    pmap(
      list(df_ = lst_data, name_ = names(lst_data), stat_ = lst_stat), \(...) density_plot(...)
    )
  },
  taskID = 'complex_example',
  assignment = list(density_plot)
)

GitHub链接(尚在测试! ): https://github.com/Vinnish-A/noter
PS: 图片正在通过Github Action上传到腾讯云图床