一个csv内的数据,希望能循环作图相邻的两列数据。
但是网上搜了好多方法,照着模仿,但都有问题。
数据大概是这样的,
|age  |Vegetation |mean_RA_AS |SE_RA_AS|mean_RA_Carb|SE_RA_Carb|
|-----|-----------|-----------|--------|------------|----------|
|<dbl>|<chr>      |<dbl>      |<dbl>   |<dbl>       |<dbl>     |
|1    |Intercanopy|1.11       |0.251   |0.235       |0.0715    |
|55   |Intercanopy|1.47       |0.120   |0.672       |0.0452    |
|750  |Intercanopy|1.24       |0.129   |0.791       |0.101     |
|3000 |Intercanopy|1.33       |0.0569  |0.961       |0.0561    |
|1    |Juniper    |0.558      |0.143   |0.298       |0.129     |
|55   |Juniper    |1.08       |0.0860  |0.773       |0.140     |
|750  |Juniper    |0.864      |0.110   |0.441       |0.140     |
|3000 |Juniper    |0.870      |0.0653  |0.441       |0.192     |
|1    |Pine       |0.481      |0.0169  |0.0846      |0.00590   |
|55   |Pine       |0.849      |0.0819  |0.734       |0.147     |
|750  |Pine       |0.657      |0.0936  |0.259       |0.0464    |
|3000 |Pine       |1.04       |0.184   |0.572       |0.157     |
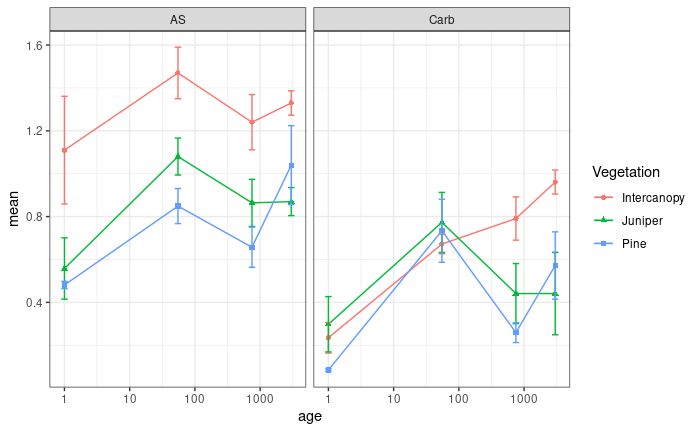
做一个 x=age,y=mean_RA_AS, errorbar=SE_RA_AS, 的点线图, 然后每两列循环,
即 第二个图 x=age, y=mean_RA_Carb , errorbar= SE_RA_Carb .
for (i in 1:19) {
  for (j in 2:20) {
    PH <- ggplot(
      classB_lignin, aes_string(x = "age", y = classB_lignin[, i + 2]),
      aes(color = Vegetation, shape = Vegetation)
    ) +
      geom_line() +
      geom_point(size = 3, alpha = 0.4) +
      geom_errorbar(aes(
        ymin = classB_lignin[, i + 2] - classB_lignin[, j + 2],
        ymax = classB_lignin[, i + 2] + classB_lignin[, i + 2]
      ),
      width = .1
      ) +
      theme_bw() +
      labs(
        x = "Age",
        y = paste0(classB_lignin[1, i]),
        title = paste0(classB_lignin[1, i])
      )
    # print(PH)
    ggsave(PH, filename = paste0(classB_lignin[, i], ".jpg"), width = 7, height = 5)
  }
}
然后报错
Error: Unknown input: tbl_df
后来我看到有用mapply
PLclass <- function(j, i) {
  ggplot(
    classB, aes_string(x = "clay", y = i),
    aes(color = Vegetation, shape = Vegetation)
  ) +
    geom_line() +
    geom_point(size = 3, alpha = 0.4) +
    geom_errorbar(aes(
      ymin = i - j,
      ymax = i + j
    ),
    width = .05
    ) +
    theme_bw() +
    labs(
      x = "Clay (g/kg)",
      y = paste0(i),
      title = paste0(i)
    )
}
p <- mapply(PLclass,
  i = c(
    "mean_RA_Lignin", "mean_MASS_Lignin", "mean_OC_Lignin", "mean_HC_Lignin",
    "mean_NC_Lignin", "mean_DBE_Lignin", "mean_AI_Lignin",
    "mean_NOSC_Lignin", "mean_DBEO_Lignin", "mean_DBE_O_Lignin"
  ),
  j = c(
    "SE_RA_Lignin", "SE_MASS_Lignin", "SE_OC_Lignin", "SE_HC_Lignin",
    "SE_NC_Lignin", "SE_DBE_Lignin", "SE_AI_Lignin",
    "SE_NOSC_Lignin", "SE_DBEO_Lignin", "SE_DBE_O_Lignin"
  )
)
Rmisc::multiplot(plotlist = p, layout = matrix(1:5, nrow = 2))
最后出来的是空白图。
不知道哪里出问题了
还是我应该先把多个列的数据,先select ,组成数据框再画?