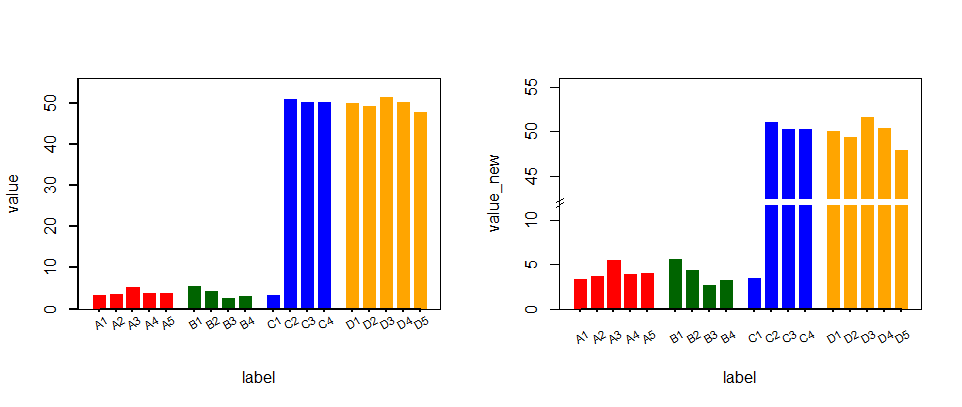
dapeng 用 base plot 比较简单。我想了个用 ggplot 的 facet 拼接上下两个图,勉强可以实现,觉得比较麻烦,权当熟悉 ggplot 了。
set.seed(123)
vl <- c(rnorm(10) + 4, rnorm(8) + 50)
grp <- c(rep("A", 5),   # 实验有 4 个分组
         rep("B", 4),
         rep("C", 4),
         rep("D", 5))
lbs <- c(paste0("A", 1:5),   # 每组数据量不一
         paste0("B", 1:4),
         paste0("C", 1:4),
         paste0("D", 1:5))
colors <- c(rep("red", 5),  # 打算每组用不同的颜色
            rep("darkgreen", 4),
         rep("blue", 4),
         rep("orange", 5))
dat <- data.frame(id = 1:18,
                  group = grp,
                  label = lbs,
                  color = colors,
                  value = vl)


# 1. 根据 facet 作图

## 先根据 gap 处的阈值设置facet, 参考dapeng的设置间断位置在12
dat$facet <- factor(ifelse(dat$value > 12, "up", "down"), levels = c("up", "down"))

library(ggplot2)
ggplot(dat, aes(label, value)) +
  geom_col(aes(fill = color), width = 0.8) +
  scale_fill_identity() +
  facet_grid(rows = vars(facet), scales = "free_y") +
  theme(strip.background = element_blank(), strip.text = element_blank(),
        legend.position = "none") # 去除legend和facet

# 2. 设置上下两个 facet 的limit
# ggplot2 目前不支持单独设置 每个 facet 的scale,在这里
# https://github.com/tidyverse/ggplot2/issues/1613#issuecomment-404143658
# 看到有个facetscales包可以用来分别设置不同facet的limit

if (!require("facetscales")) remotes::install_github("zeehio/facetscales")
#> Loading required package: facetscales
scales_y <- list(
  "down" = scale_y_continuous(limits = c(0, 12), breaks = seq(0, 12, 3), expand = c(0,0)),
  "up" = scale_y_continuous(limits = c(40, 55), breaks = seq(40, 55, 5))
)

ggplot(dat, aes(label, value)) +
  geom_col(aes(fill = color), width = 0.8) +
  scale_fill_identity() +
  facet_grid_sc(rows = vars(facet), scales = list(y = scales_y)) +
  theme(strip.background = element_blank(), strip.text = element_blank(),
        legend.position = "none")

# 3. gap 12 和 40离的太近
# 减小上面 facet y的最小值 40 -> 35,
# 增加下面 facet 最大值 12 -> 15, 同时需要设置dat2$value为15
scales_y <- list(
  "down" = scale_y_continuous(
    limits = c(0, 15),
    breaks = seq(0, 12, 3),
    expand = c(0,0)),
  "up" = scale_y_continuous(limits = c(35, 55), breaks = seq(40, 55, 5))
)
ggplot(dat, aes(label, value)) +
  geom_col(aes(fill = color), width = 0.8) +
  scale_fill_identity() +
  facet_grid_sc(rows = vars(facet), scales = list(y = scales_y)) +
  theme(strip.background = element_blank(), strip.text = element_blank(),
        legend.position = "none")

# 4. 在下面的facet中添加数据,C2:D5 的 value 为 15 (limit的最大值), facet 为 "down"
dat2 <- dat[dat$facet == "up", ]
dat2$value <- 15
dat2$facet <- "down"
dat <- rbind(dat, dat2)

ggplot(dat, aes(label, value)) +
  geom_col(aes(fill = color), width = 0.8) +
  scale_fill_identity() +
  facet_grid_sc(rows = vars(facet), scales = list(y = scales_y)) +
  theme(strip.background = element_blank(), strip.text = element_blank(),
        legend.position = "none")

# 5. 分组之间的 space,设置 facet_grid 中的 cols
ggplot(dat, aes(label, value)) +
  geom_col(aes(fill = color), width = 0.8) +
  scale_fill_identity() +
  facet_grid_sc(
    rows = vars(facet),
    cols = vars(group),
    scales = list(y = scales_y, x = "free")) +
  theme_classic() +
  theme(strip.background = element_blank(),
        strip.text = element_blank(),
        legend.position = "none")

<sup>Created on 2020-12-19 by the reprex package (v0.3.0)</sup>