导出png格式的图片是正常的,但是eps字体就锯齿状,变得很丑。尝试用showtext package解决,但没有啥改善。不知道各位大侠有没有遇到过这种情况
require(ggplot2)
require(reshape)
require(scales)

data<-c(6.1118735e-01,5.7301717e-01,2.2237470e-01,1.5018730e-02,2.0725848e+00,1.0289954e+00,
  4.8397492e-01,8.7583092e-01,2.2596239e-01,8.0458177e-03,8.1572366e-01,3.6434830e-01,
  4.1028456e-01,1.0966264e+00,2.1371275e-01,5.7115405e-03,5.3829475e-01,1.9316991e-01,
  3.6397288e-01,1.2624198e+00,2.0496610e-01,3.6012269e-03,3.6015218e-01,9.7513401e-02,
  3.3412221e-01,1.3922213e+00,2.0094665e-01,2.8147637e-03,2.6500819e-01,6.2578334e-02,
  3.0057859e-01,1.5265155e+00,1.8400836e-01,2.4551198e-03,2.2651917e-01,4.6359734e-02,
  2.6760146e-01,1.6611976e+00,1.6297310e-01,2.2719469e-03,2.0509064e-01,3.7372983e-02,
  2.7596397e-01,1.6884784e+00,1.8545947e-01,1.5917279e-03,1.5101354e-01,2.3143112e-02,
  2.5369621e-01,1.7907971e+00,1.7077357e-01,1.5435199e-03,1.3713225e-01,2.0068745e-02,
  2.4634037e-01,1.8543358e+00,1.7097441e-01,1.3207863e-03,1.2375078e-01,1.5677608e-02,
  2.3430978e-01,1.9284716e+00,1.6470158e-01,1.1834995e-03,1.1506407e-01,1.2856788e-02,
  2.3530441e-01,1.9696125e+00,1.7157977e-01,1.2034389e-03,1.0645448e-01,1.2041785e-02,
  2.2887375e-01,2.0288787e+00,1.6955635e-01,1.1584506e-03,1.0104894e-01,1.0760833e-02,
  2.2390602e-01,2.0810058e+00,1.6847074e-01,1.0979704e-03,9.6314605e-02,9.5362413e-03,
  2.1424232e-01,2.1446170e+00,1.6185848e-01,1.0376701e-03,9.2578407e-02,8.4448932e-03,
  2.1580665e-01,2.1698264e+00,1.6679456e-01,9.6708127e-04,8.4782482e-02,7.4145949e-03,
  2.1269004e-01,2.2097807e+00,1.6637769e-01,9.2068600e-04,8.1436531e-02,6.6720930e-03,
  2.1227118e-01,2.2530114e+00,1.6850846e-01,9.5138133e-04,8.4715820e-02,6.6913101e-03,
  2.1757255e-01,2.2610873e+00,1.7639215e-01,8.4615162e-04,7.4919540e-02,5.5234052e-03)

names(indice)<-c("PC","CE","MPC","S","SC","XB")
c<-2:20

plot.data<-data.frame(c,indice)
plot.data<-melt(plot.data,id.vars="c")

windowsFonts(consolas=windowsFont("consolas"))
# font.add("consolas","C:/Windows/Fonts/consola.ttf")
# showtext.begin()
handle<-ggplot(plot.data,aes(x=c,y=value,colour=variable,shape=variable))+
  geom_point(size=4)+
  geom_line()+
  theme_bw()+
  theme(axis.text.x=element_text(family="consolas",size=14),
        axis.text.y=element_text(family="consolas",size=14),
        axis.title=element_text(family="consolas",size=18),
        legend.text=element_text(family="consolas",size=14),
        legend.title=element_text(family="consolas",size=14))+
  annotation_logticks(sides="l")+
  scale_y_log10(breaks=trans_breaks("log10",function(x) 10^x),
                labels=trans_format("log10",math_format(10^.x)),
                minor_breaks=log10(5)+-1:3)
# showtext.end()
setEPS()
postscript("cn.eps")
showtext.begin()
handle
showtext.end()
dev.off()
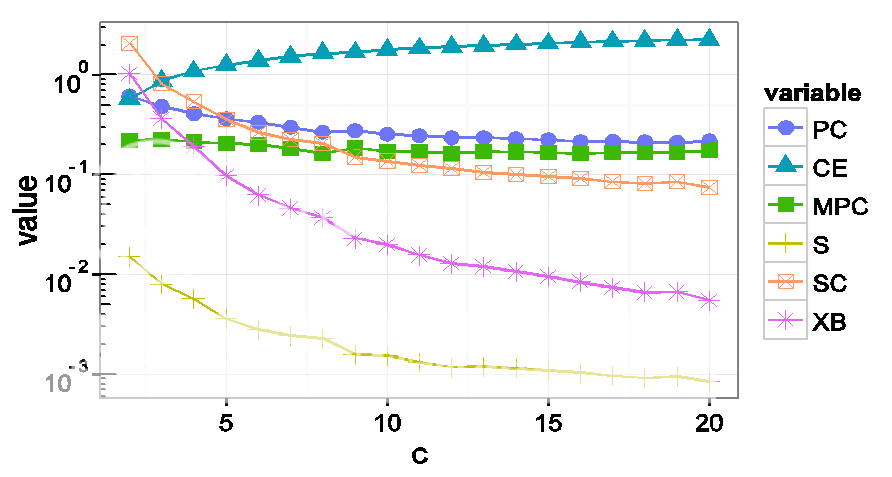
这是导出png的图片
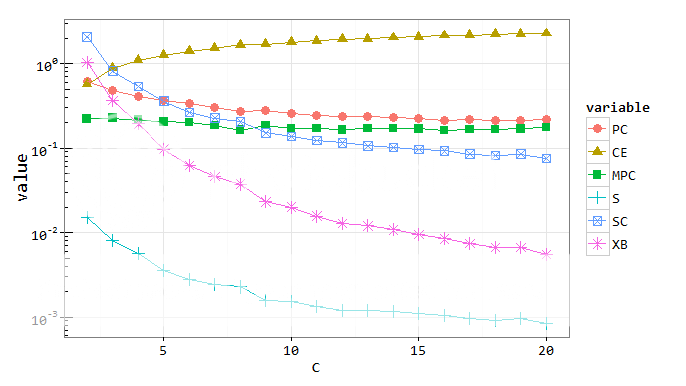
这是eps的图片