最近学qqplot画误差线图,遇到了一个比较郁闷的问题[s:15],请大家帮帮忙啊:
通过 data <- read.frame() 导入了下面的数据:
condition times values
untreat 1h 1
treat 1h 3
untreat 2h 2
treat 2h 6
然后是:
p <- ggplot(data, aes(fill=condition, y=values, x=times))
limits <- aes(ymax = values + 0.1, ymin=values - 0.1)
dodge <- position_dodge(width=0.9)
p + geom_bar(position="dodge", stat="identity")+ geom_errorbar(limits, position=dodge, width=0.1)
做出来的图片是这个样子的:
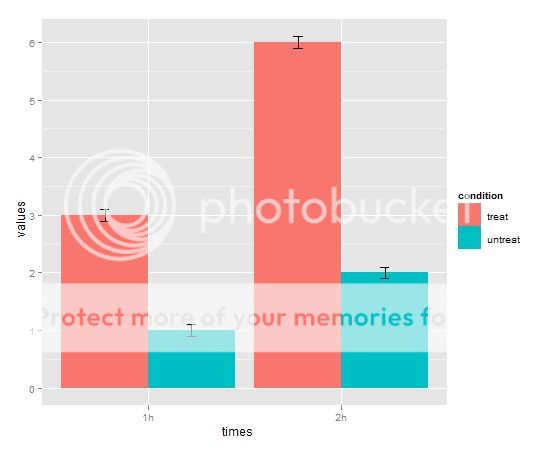
明明我的untreated组应该在前面啊,结果被排到了后面。
我看了一下变量的属性:
> str(data)
'data.frame': 4 obs. of 3 variables:
$ condition: Factor w/ 2 levels "treat","untreat": 2 1 2 1
$ times : Factor w/ 2 levels "1h","2h": 1 1 2 2
$ values : int 1 3 2 6
似乎和condition的levels有关,直接用factor命令修改levels,好像也不起作用[s:12]。
另外,我想去掉图示里面的condition这个单词,应该要怎么办啊?请大虾们给支支招~~~